Creating the Metropolis-2 style
There is already a nice tutorial on how to use maputnik for custom styles.
It has an online version that can sync with your local style.json. The benefit is that if you just create
a vanilla mbtiles file with OpenMapTiles then you can design your style without adding your local mbtiles
to maputnik becuase maputnik can serve tiles from MapTiler without an api key. However, when serving with TileServer GL
you need to replace the tile source, sprites, and glyphs paths with a local path or get a MapTiler api key.
Note
OpenMapTiles provides several open source styles that are a good starting point for beginners. These can be loaded directly into maputnik.
You can use any tiles in maputnik as long as they adhere to the mbtiles convention.
I alternate between mapbox and MapTiler. However a MapTiler style is not compatible with a mapbox style
even if they both use OpenStreetMap as they have different layers.
For Metropolis-2, it is not possible to design the style this way because it does not use the same layer schema as OpenMapTiles or Maptiler. Since, we modified the data considerably we need to add them as a source.
Adding our local tiles to maputnik
There is no way to directly add m2.mbtiles as a source to maputnik. Among other things, it accepts GeoJSON and TileJSON
but not mbtiles. Luckily, TileServer GL can serve an mbtiles file as a TileJSON. If you look at the image
of the TileServer GL homepage above you can see that there is a TileJSON button. If you click that and get the url it looks like this:
http://localhost:8080/data/v3.json
So ideally, we can now add this url to maputnik and see our data. However, to do this we need the local maputnik CLI
because the online editer only works with Hypertext Transfer Protocol Secure (https). So unless you serve the tiles to a public url
you will not be able to see the data.
Serve a TileJSON
Now we are ready to serve the Metropolis-2 tiles to start designing our style.
So at this point we can make changes to openmaptiles/data before starting the server.
Step 1
Place m2.mbtiles in openmaptiles/data
Step 2
Place the following config.json in openmaptiles/data
{
    "options": {
      "paths": {
        "root": "",
        "fonts": "fonts",
        "styles": "styles",
        "mbtiles": ""
      }
    },
    "data": {
      "v3": {
        "mbtiles": "m2.mbtiles"
      }
    }
  }
Note how that by setting "root": "" the root directory will be inside /data/ in the docker container.
Step 3
Make a directory called fonts in openmaptiles/data and copy the fonts created with OpenMaptiles fonts.
Step 4
Make a directory called styles in openmaptiles/data. It can remain empty for the time being.
At this point your openmaptiles/data directory should look like this:
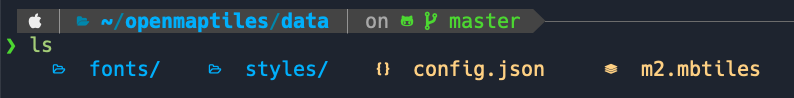
Step 5
Start the server by running make start-tileserver in openmaptiles.
Now visit http://localhost:8080 and you should only see your data. If you click “inspect” you should see
something like this
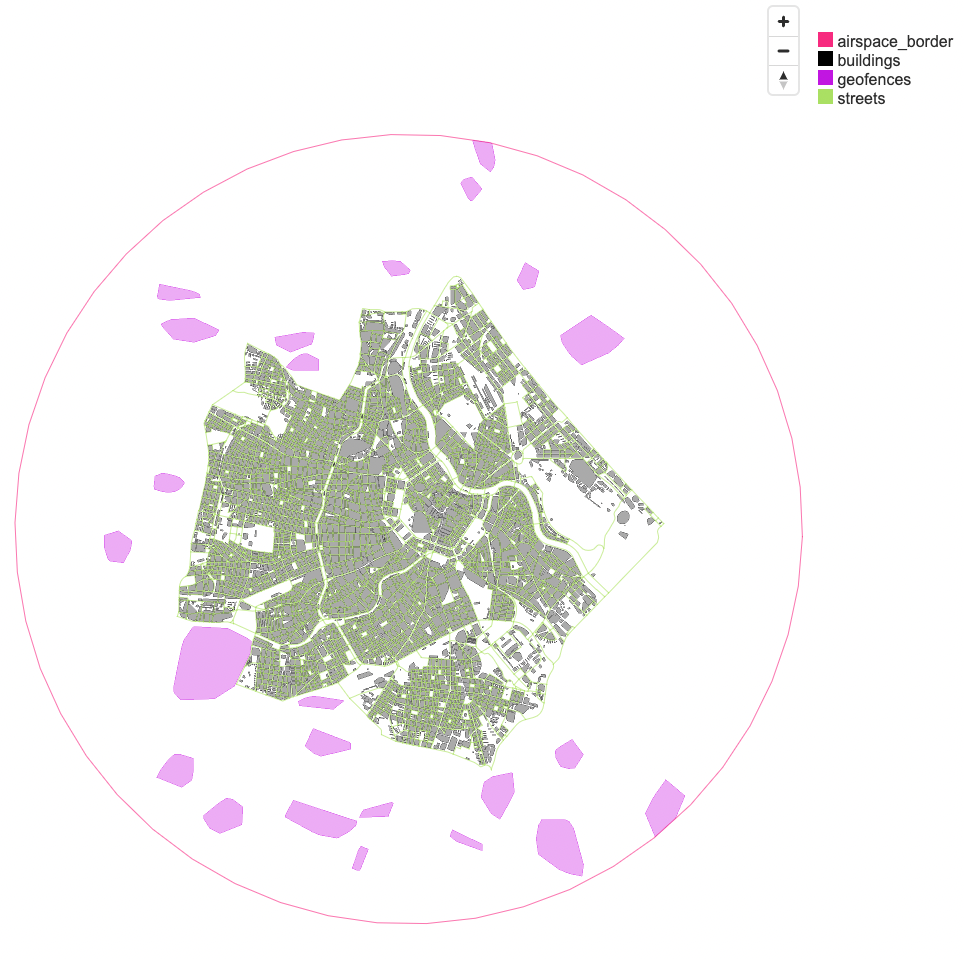
Note the 4 available layers in the top right and how you can hover over the geometry to get more information.
Step 6
In the home page of the server you can now find the link to the TileJSON:
http://localhost:8080/data/v3.json
Note how it is an http url.
Add http url as a source in maputnik
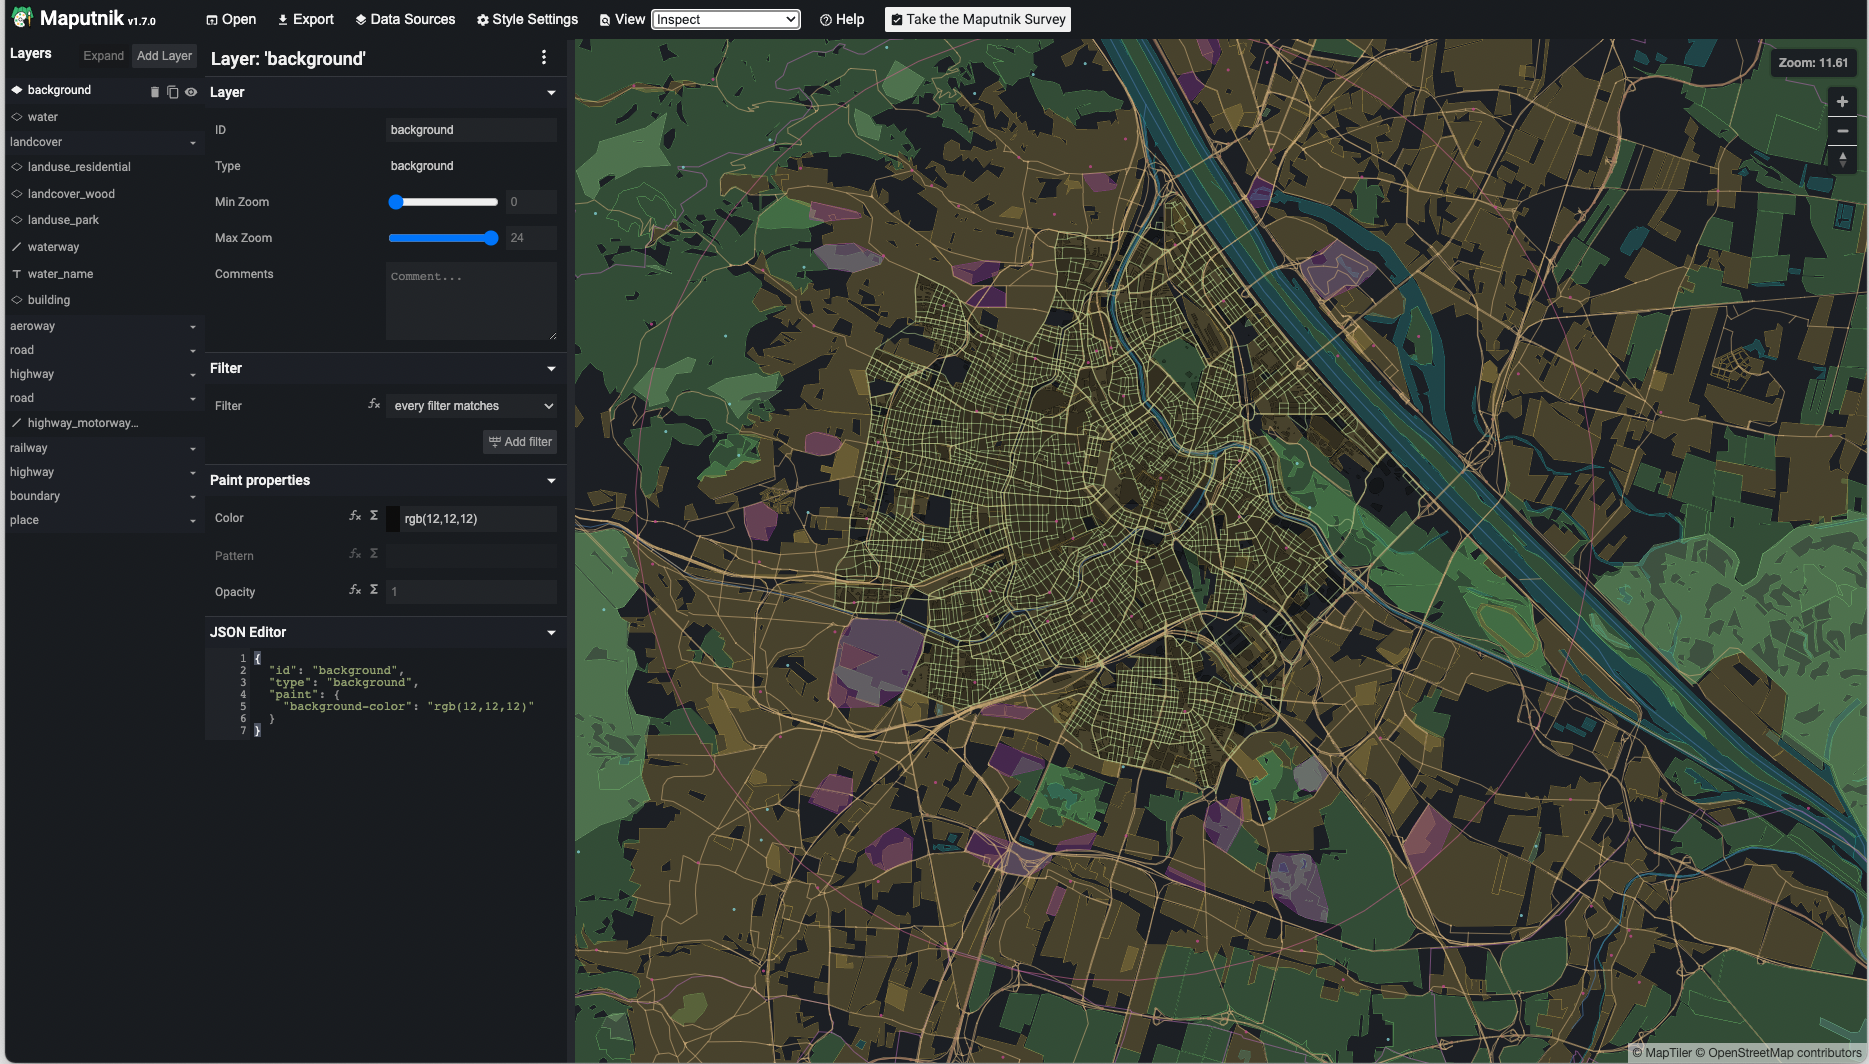
Now that the server is running with the Metropolis-2 tiles, we can add it as a source to maputnik. The Metropolis-2 style will be inspired by the dark matter style from OpenMaptiles.
Step 1
Download the dark matter style.json from github
https://github.com/openmaptiles/dark-matter-gl-style/blob/master/style.json
then place it inside openmaptiles/data/styles.
Step 2
Change line 2 to "name": "m2",
Step 3
Assuming you have installed the Maputnik-CLI correctly run maputnik --watch --file style.json
from openmaptiles/data/styles. This will make sure any changes made in maputnik are saved
to your file.
If it went well, you can now visit
and you will see the maputnik editor with the dark matter style.
Step 4
Click Data Sources at the top of the page and add the the source in the pop-up window.
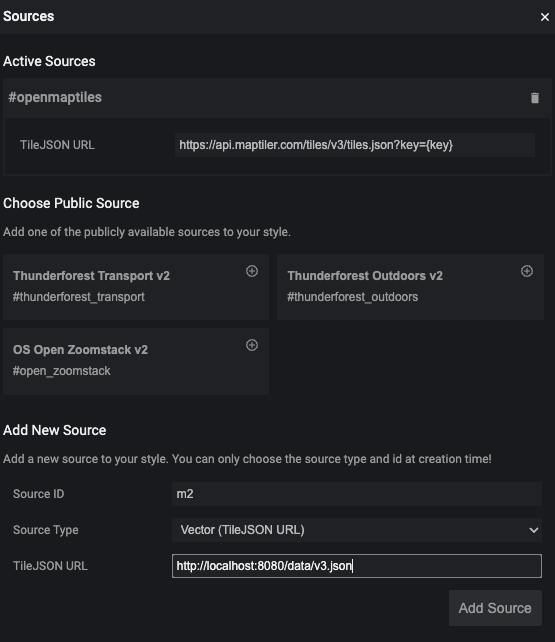
If you click View at the top and select Inspect and then navigate to Vienna you will see our Data overlayed with the MapTiler data.
Note
We could already remove the openmaptiles source. However, because all the style layers reference it, removing it would give us a big error and make it difficult to style.
For the time being it is better to modify the style layers.
Make style layers
Now we can start making our styling layers which will reference the mbtiles layers
airspace_border
buildings
geofences
streets
There are already some good tutorials for styling with maputnik on their github so I will not spend too much time describing it.
Here I will go over the main general steps for the Metropolis-2 style.
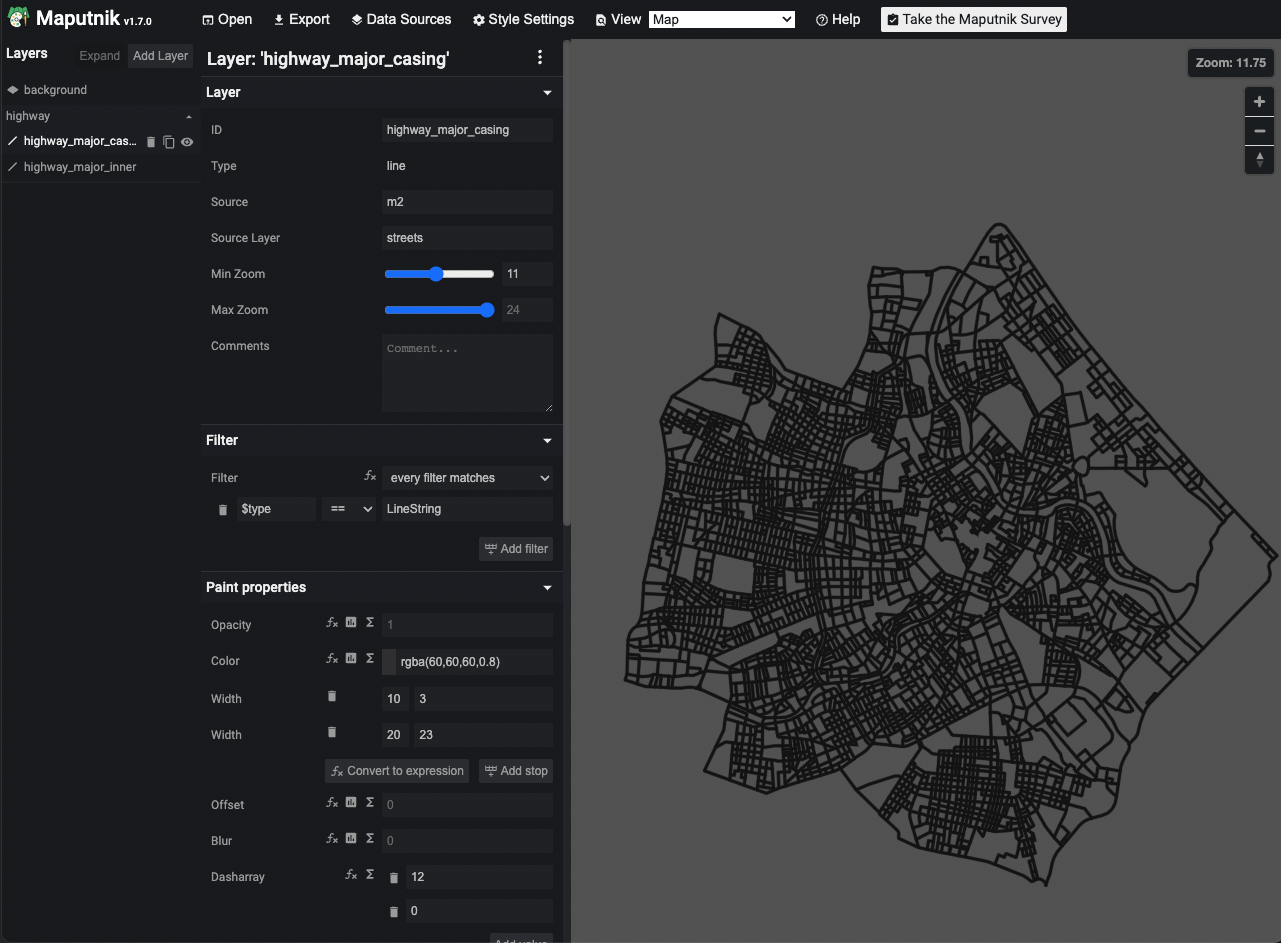
Streets layer
For this layer I just slightly modified two style layers
highway_major_casinghighway_major_casing
This involved:
changing the source to
m2and the source layer tostreets.removing the class filter.
Makinf the backgrounda little lighter.
Change the minimum zoom to 9.
I then deleted the rest of the layers. Now everything is referencing m2 so I can remove the OpenMaptiles source.
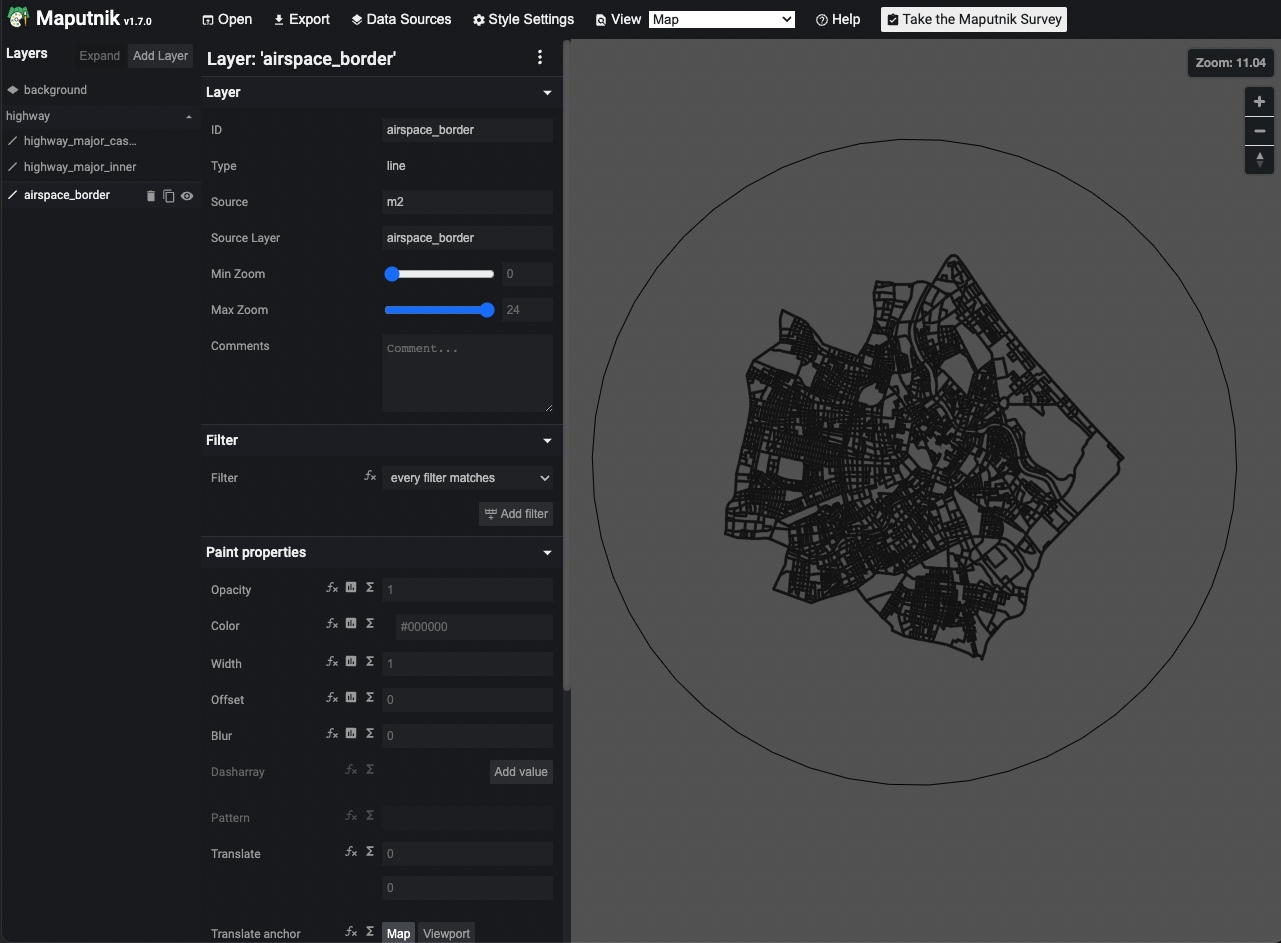
Airspace border layer
The airspace border is just a simple line. The main thing is that I want it to be available at all zoom levels.
Geofence layer
This will require two style layers. One for the geometry and one for the label of the geofence.
For the geometry, all we need to do is create a fill layer add an outline color and make it available to a minimum of zoom 8.
For the label, we use the id property and make it available only when zoomed in to at least a zoom level of 15.
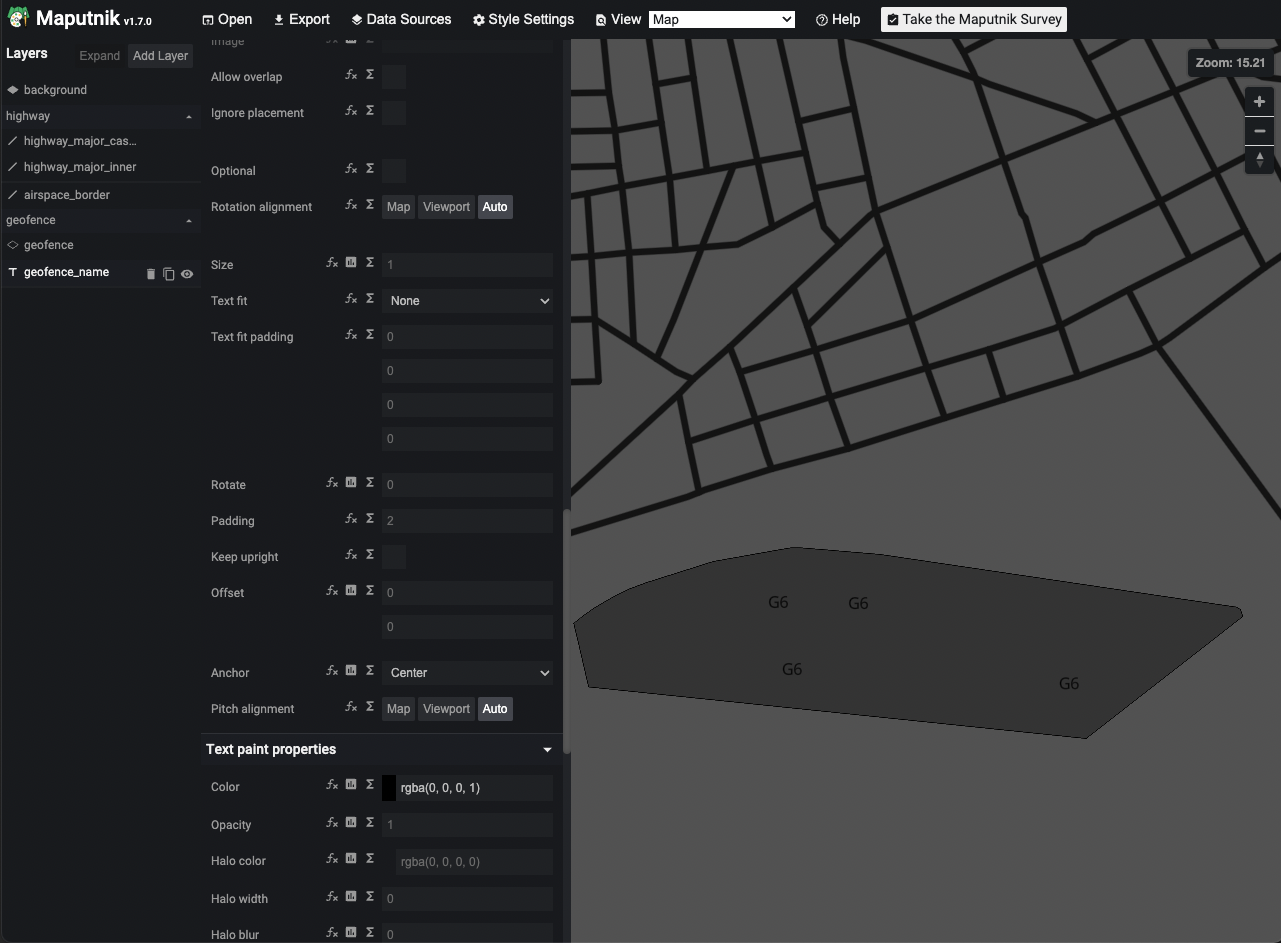
The font, Open Sans Regular, is located at openmaptiles/data/fonts.
Building layer
The building layer is pretty much the same as the geofence layer. The main difference is that the geometry and labels are only visible at a minimum zoom level of 15.
In this case the label is called fid.
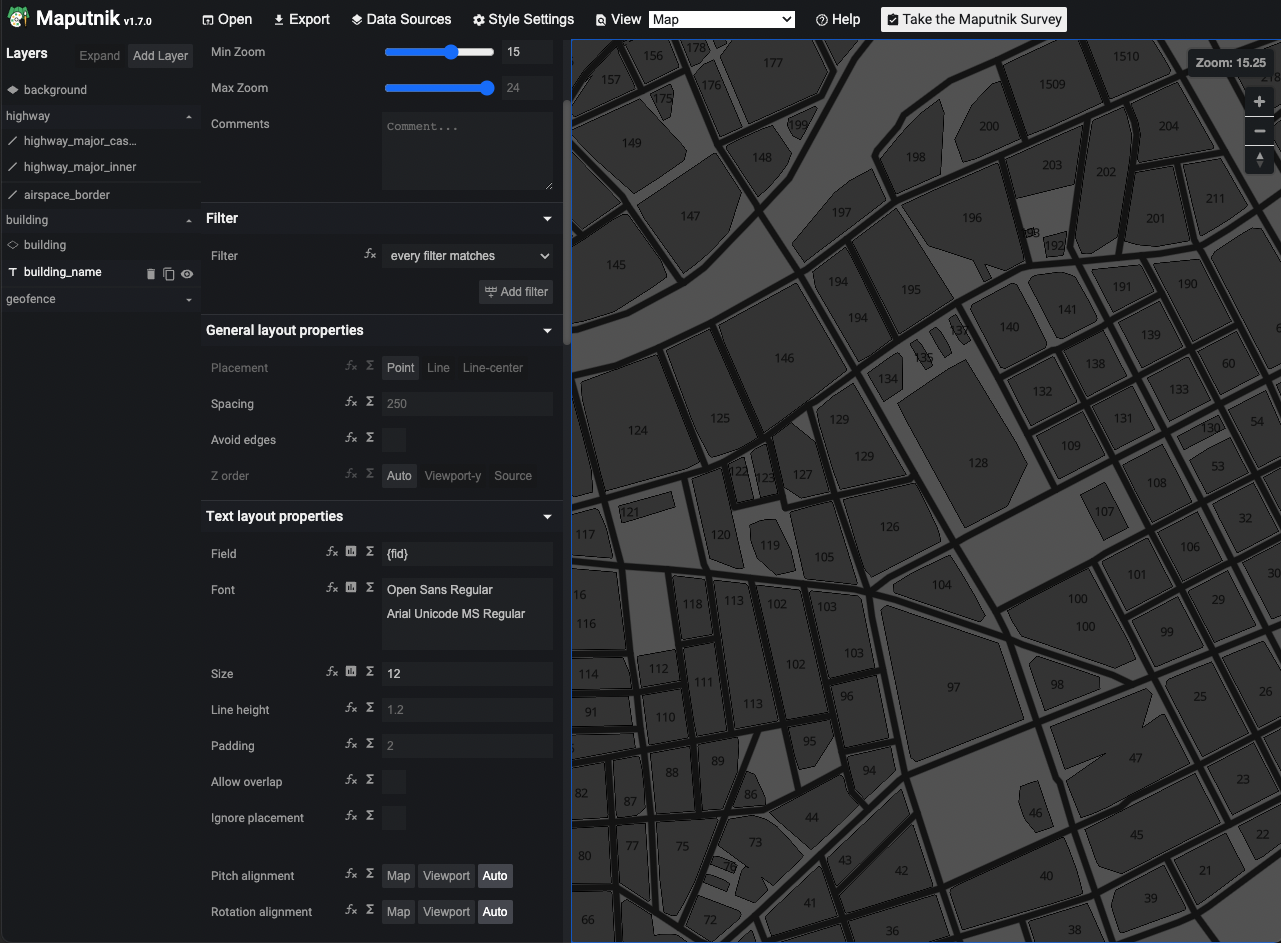
Maputnik saves the style.json automatically so we can close a maputnik and our data tile server.
Serving the styled tiles
At this point we have a working style for the m2.mbtiles However, the config.json and style.json
are still not ready for TileServer GL.
Final touches to style.json
After playing with the style schema in maputnik there are still some small changes needed to make sure the tile server works.
Ensure the name is
m2Change the sources url to
"url": "mbtiles://{v3}"Change the glyphs to
"glyphs": "{fontstack}/{range}.pbf"Delete the
spritesentry.Change the id entry to
"id": "m2"Delete the metadata entry (not required)
The style.json file ends up like this,
{
  "version": 8,
  "name": "m2",
  "sources": {
    "m2": {
      "type": "vector",
      "url": "mbtiles://{v3}"
    }
  },
  "glyphs": "{fontstack}/{range}.pbf",
  "layers": [
    {
      "id": "background",
      "type": "background",
      "paint": {
        "background-color": "rgba(92, 92, 92, 1)"
      }
    },
    {
      "id": "highway_major_casing",
      "type": "line",
      "metadata": {
        "mapbox:group": "b6371a3f2f5a9932464fa3867530a2e5"
      },
      "source": "m2",
      "source-layer": "streets",
      "minzoom": 9,
      "filter": [
        "all",
        [
          "==",
          "$type",
          "LineString"
        ]
      ],
      "layout": {
        "line-cap": "butt",
        "line-join": "miter",
        "visibility": "visible"
      },
      "paint": {
        "line-color": "rgba(60,60,60,0.8)",
        "line-dasharray": [
          12,
          0
        ],
        "line-width": {
          "base": 1.3,
          "stops": [
            [
              10,
              3
            ],
            [
              20,
              23
            ]
          ]
        }
      }
    },
    {
      "id": "highway_major_inner",
      "type": "line",
      "metadata": {
        "mapbox:group": "b6371a3f2f5a9932464fa3867530a2e5"
      },
      "source": "m2",
      "source-layer": "streets",
      "minzoom": 9,
      "filter": [
        "all",
        [
          "==",
          "$type",
          "LineString"
        ]
      ],
      "layout": {
        "line-cap": "round",
        "line-join": "round",
        "visibility": "visible"
      },
      "paint": {
        "line-color": "hsl(0, 0%, 7%)",
        "line-width": {
          "base": 1.3,
          "stops": [
            [
              10,
              2
            ],
            [
              20,
              20
            ]
          ]
        }
      }
    },
    {
      "id": "airspace_border",
      "type": "line",
      "source": "m2",
      "source-layer": "airspace_border",
      "paint": {
        "line-color": "rgba(0, 0, 0, 1)",
        "line-width": 2
      }
    },
    {
      "id": "building",
      "type": "fill",
      "source": "m2",
      "source-layer": "buildings",
      "minzoom": 15,
      "paint": {
        "fill-color": "rgba(59, 59, 59, 1)",
        "fill-outline-color": "rgba(0, 0, 0, 1)",
        "fill-translate-anchor": "map"
      }
    },
    {
      "id": "building_name",
      "type": "symbol",
      "source": "m2",
      "source-layer": "buildings",
      "minzoom": 15,
      "layout": {
        "text-field": "{fid}",
        "symbol-placement": "point",
        "symbol-z-order": "auto",
        "text-size": 12,
        "text-font": [
          "Open Sans Regular"
        ]
      },
      "paint": {
        "text-color": "rgba(0, 0, 0, 1)"
      }
    },
    {
      "id": "geofence",
      "type": "fill",
      "source": "m2",
      "source-layer": "geofences",
      "minzoom": 8,
      "paint": {
        "fill-color": "rgba(59, 59, 59, 1)",
        "fill-outline-color": "rgba(0, 0, 0, 1)",
        "fill-translate-anchor": "map"
      }
    },
    {
      "id": "geofence_name",
      "type": "symbol",
      "source": "m2",
      "source-layer": "geofences",
      "minzoom": 15,
      "layout": {
        "text-field": "{id}",
        "symbol-placement": "point",
        "symbol-z-order": "auto",
        "text-size": 12,
        "text-font": [
          "Open Sans Regular"
        ]
      },
      "paint": {
        "text-color": "rgba(0, 0, 0, 1)"
      }
    }
  ],
  "id": "m2"
}
Final touches to config.json
Now we need to add a style entry so the tile server can use our m2 style.
This final config file looks like this,
{
    "options": {
      "paths": {
        "root": "",
        "fonts": "fonts",
        "styles": "styles",
        "mbtiles": ""
      }
    },
    "styles": {
      "m2": {
        "style": "style.json",
        "tilejson": {
          "bounds": [
            16.254755,
            48.133106,
            16.469847,
            48.276893
          ]
        }
      }
    },
    "data": {
      "v3": {
        "mbtiles": "m2.mbtiles"
      }
    }
  }
Serve the final tiles
After modifying the schema we can restart the tile server by running make start-tileserver
from openmaptiles.
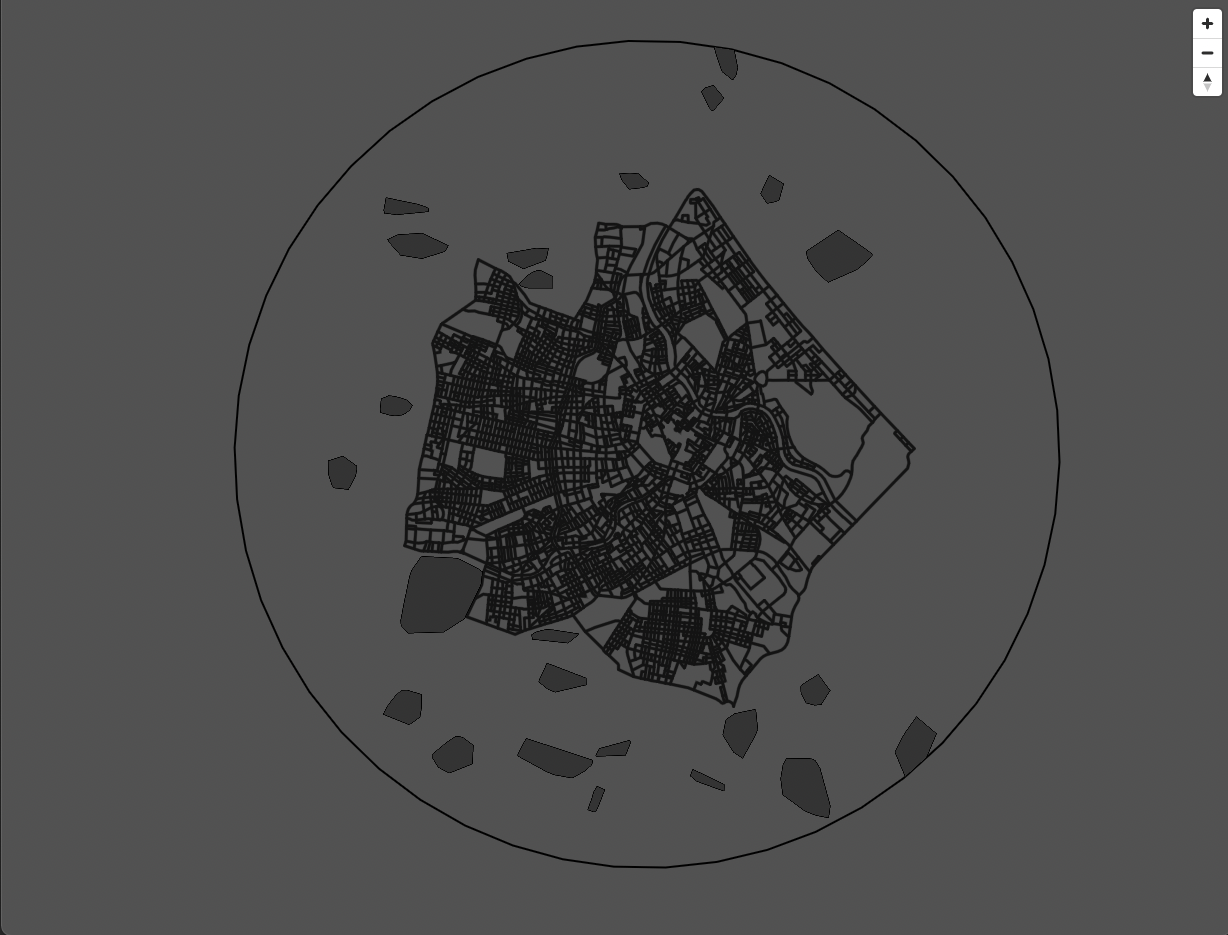
And if we go to the viewer we can see our scrollable Metropolis-2 map!